
Effective Speed Comparison
Gaming is by far the most demanding CPU activity for most users. CPU Effective Speed is calibrated to estimate differences in EFps between PCs. We publish EFps data, with source video footage, for hundreds of PC configurations using replicable gameplay in the world’s most popular games.
AMD's 5000 series launch event
During AMD's 5000 series launch presentation, 1080p game benchmarks were presented for their new 5900X the 3900XT and Intel's 10th Gen i9-10900K. Footage of the gameplay was omitted, so third party validation is not possible.
AMD's figures: 5900X 7% faster than 10900K
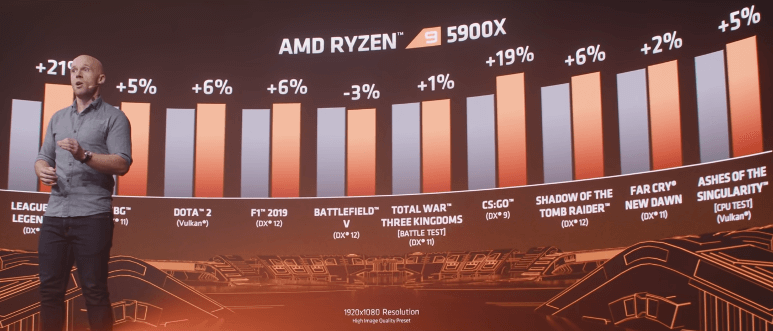
| LOL | PUBG | DOTA2 | F1 | BFV | TWTK | CSGO | SOTTR | FCND | AOTS | Avg. |
|---|---|---|---|---|---|---|---|---|---|---|
| 21% | 5% | 6% | 6% | -3% | 1% | 19% | 6% | 2% | 5% | 6.8% |
AMD's figures: 10900K around 19% faster than 3900XT
A simple calculation using AMD's results shows that the 10900K outperforms the 3900XT by around 19% in gaming:
| LOL | PUBG | DOTA2 | F1 | BFV | TWTK | CSGO | SOTTR | FCND | AOTS | Avg. | |
|---|---|---|---|---|---|---|---|---|---|---|---|
| 5900X v 10900K† | 21% | 5% | 6% | 6% | -3% | 1% | 19% | 6% | 2% | 5% | 6.8% |
| 5900X v 3900XT† | 50% | 33% | 24% | 24% | 5% | 6% | 46% | 28% | 22% | 19% | 25.7% |
| 10900K v 3900XT‡ | 29% | 28% | 18% | 18% | 8% | 5% | 27% | 22% | 20% | 14% | 18.9% |
†Source: AMD - Where Gaming Begins (8 October 2020) ‡Calculated
Intel's 10th Gen resoundingly beat AMD's 3000 series
AMD's figures show that Intel's 10th Gen CPUs are around 19% faster for gaming than AMD's 3000 series. This is a remarkable admission given the overwhelmingly pro-gaming narrative that accompanied the 3000 series marketing campaign. UserBenchmark’s Effective Speed marks Intel's lead at just 14%.
AMD outsold Intel whilst Intel was 15% faster
Between 2017 and 2021 AMD's market capitalization increased from $10 billion to $110 billion. Marketers (youtube, reddit, forums etc.) shared in this success by persuading PC gamers to buy AMD CPUs whilst downplaying Intel's performance lead. Intel's marketing team remain asleep at the wheel.
AMD's 5000 series is competitive with Intel's 10th Gen
AMD's tests, with their own choice of games, marked their 5900X 7% faster than the 10900K. Benchmark footage, game settings and hardware details were not provided.
UserBenchmark's Effective Speed marks the 5900X 1% faster than the 10900K. Effective Speed is calibrated to EFps game data which is generated using retail hardware in our lab with replicable scenes from five of the world's most popular games.
Intel's 11-12th Gen is 3-13% faster than AMD's 5000 series
2024 Hardware Rankings
PC Score |
PC Status |
|
|---|---|---|
| 8 secs agoZ790 GAMING PRO WIFI (MS-7D9... | UFO | 82% |
| 1 min agoAsus PRIME Z790-P | UFO | 66% |
| 1 min agoLenovo 81DE | Destroyer | 57% |
| 1 min agoROG CROSSHAIR VIII DARK HERO | UFO | 71% |
| 1 min agoMegaport MS-7C75 | Nuclear submarine | 54% |
| 1 min agoAsus H97M-PLUS | Tree trunk | 63% |
| 2 mins agoJginyue B650I Night Devil | Tree trunk | 59% |
| 2 mins agoE5 INTEL (INTEL Xeon E5/Core... | Battleship | 55% |
| 2 mins agoROG STRIX B550-F GAMING (WI-... | Tree trunk | 63% |
| 2 mins agoTUF GAMING B760-PLUS WIFI D4 | UFO | 60% |
| 2 mins agoMAG X670E TOMAHAWK WIFI (MS-... | Tree trunk | 65% |
| 2 mins agoMAG X670E TOMAHAWK WIFI (MS-... | Tree trunk | 53% |
| 2 mins agoMSI A320M-A PRO (MS-7C51) | Aircraft carrier | 60% |
| 3 mins agoGA-B550M AORUS ELITE | Tree trunk | 39% |
| 3 mins agoAsus A88X-PLUS/USB 3.1 | Tree trunk | 53% |
| 3 mins agoGigabyte GA-B760M DS3H DDR4 | UFO | 77% |
| 3 mins agoROG STRIX Z790-E GAMING WIFI | UFO | 50% |
| 3 mins agoRazer Blade 14 - RZ09-0370 | Nuclear submarine | 66% |
| 3 mins agoApple MacPro6,1 | Tree trunk | 28% |
| 3 mins agoMSI B450-A PRO MAX (MS-7B86) | Tree trunk | 4% |